
We’ve already reported on Sony’s less than stellar which saw the company lose 255 billion yen ($3.2 billion) for the January-March time period alone. With its biggest ever annual loss, Sony still expects to turn things around in 2013, the year the company predicts it will return to profit. Despite a healthy array of products on the market, Sony lost more money last year than in any other year. With increased competition from rivals Apple and Samsung and the devastating Thailand floods and Japanese earthquakes, Sony was unable to connect to consumers and deliver products on time, resulting in lower sales, down 18.8% across the entire company.
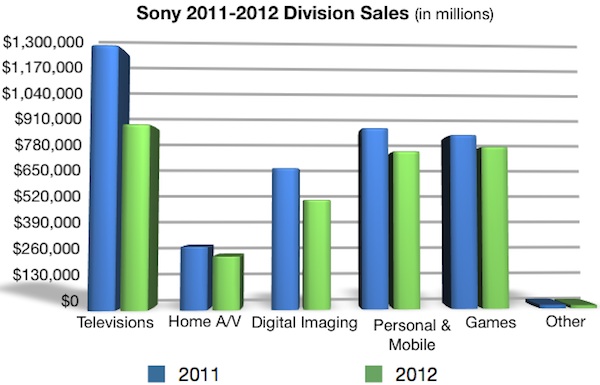
Sony’s annual division sales (pictured above) broke down as:
- Televisions -30.0%
- Home Audio and Video -15.2%
- Digital Imaging -22.5%
- Personal and Mobile Products -12.8%
- Games -6.8%
- Other -12.4%
After the jump, Sony’s sales numbers via territories.
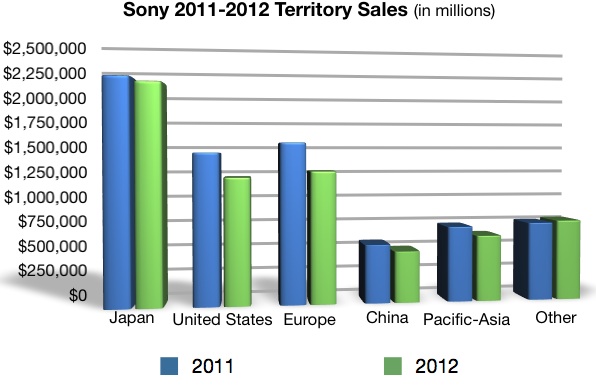
With annual sales down nearly 19%, Sony saw a decline in nearly every territory with Europe and United States, arguably the most important in consumer electronic sales down the biggest.
- Japan -2.2%
- United States -16.1%
- Europe -17.6%
- China -11.9%
- Asia-Pacific -12.4%
- Other Areas +2.6%
Discuss:
What territory should Sony focus in on the most?
You must be logged in to post a comment.